Oregon grape
conservation
pilot project
data analysis
Reading time: 5 minutes
Life Cycle
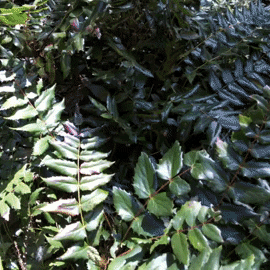
Berberis nervosa, and its cousin, Mahonia nervosa are species of Oregon Grape. They grow slowly to about two feet in the Douglas-fir forests of the Pacific Northwest.
Pollinators love its yellow flowers, which typically emerge in late March/early April, flowering through April and May depending on the amount of shade.
The resulting berries are a dusty-blue, and are what earn this plant the name “grape”. Don’t be fooled! These berries are edible, but quite tart - making them better suited for jams than wine.
Phenology – biological events that depend on climate
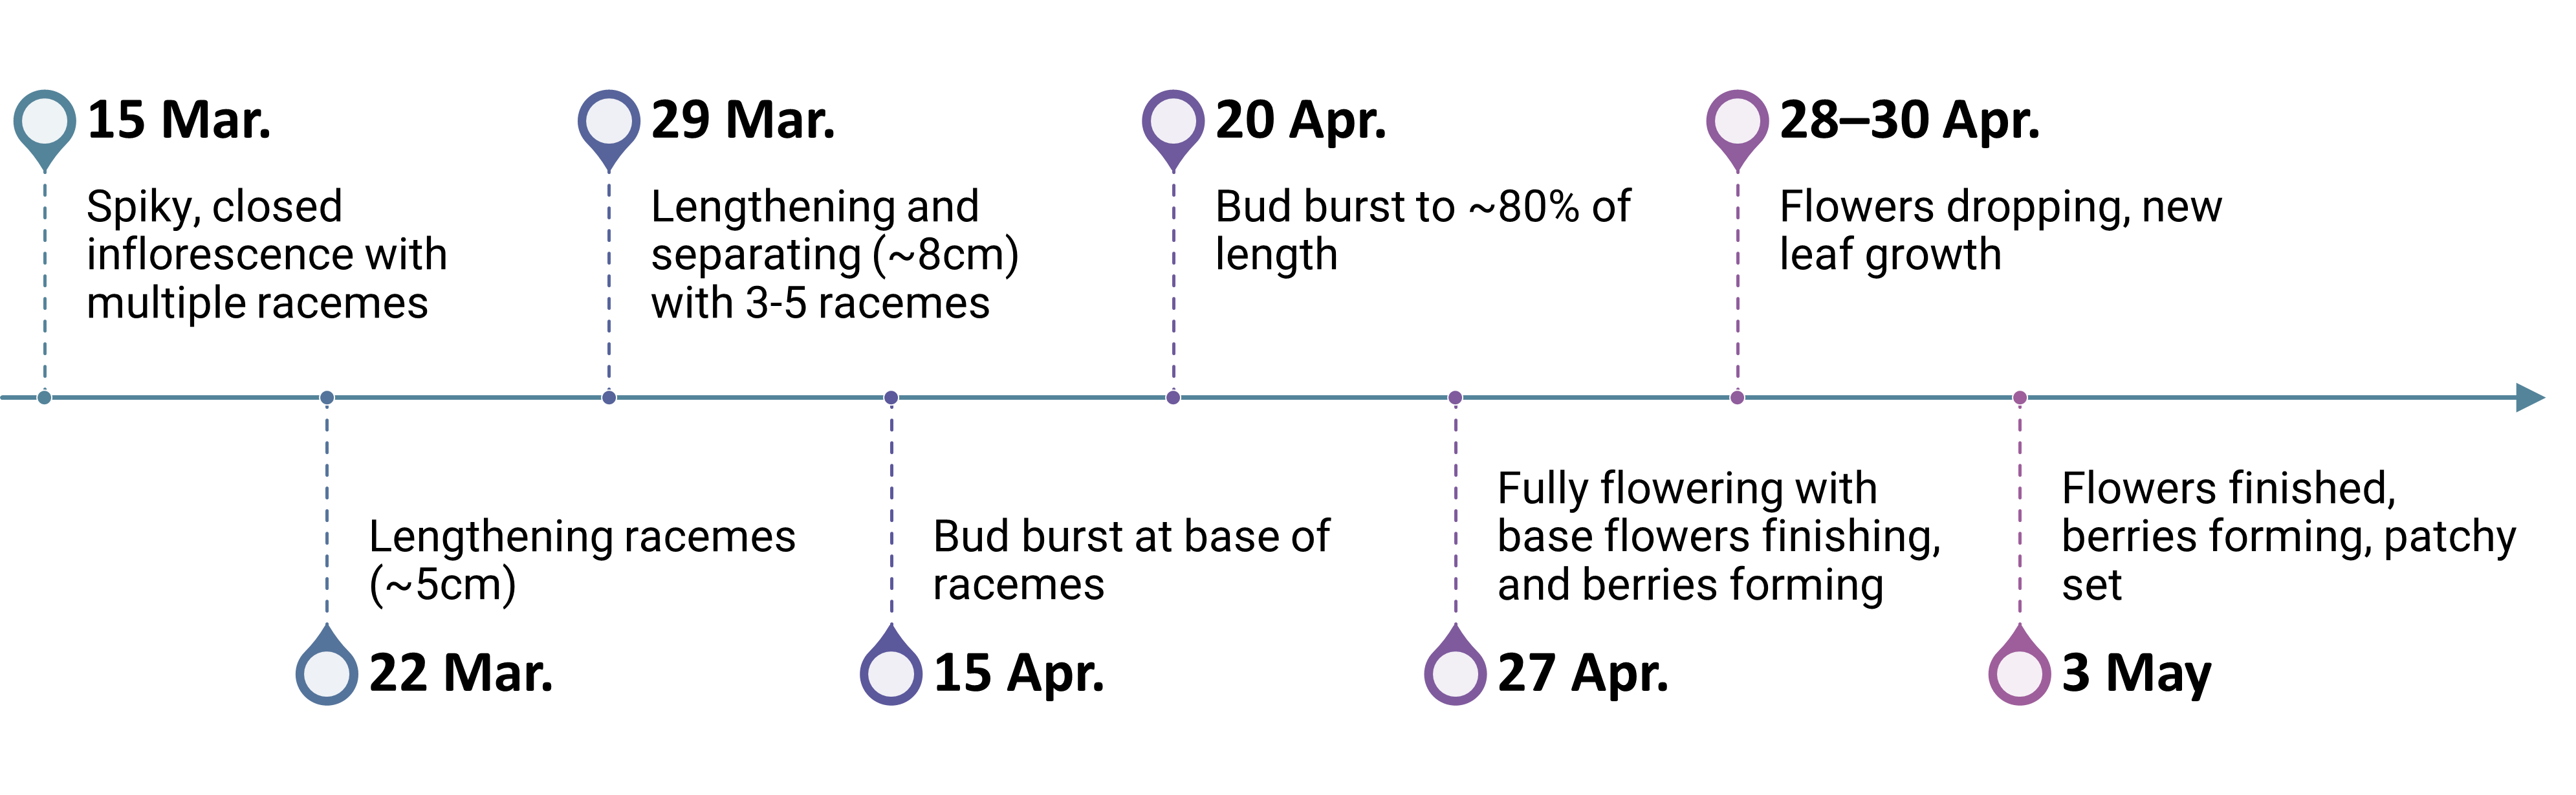
We collected data from March to May 2021: spanning growth of inflorescence (a cluster of flowers), emergence of racemes (flower stalks), blossoming, and fruit sets.
This data is multimodal, and comprised of:
- Weather conditions
- FIT counts (flower-insect timed counts)
- Video footage
- Time lapse images
- Pollinator counts
- Pollinator ID
Weather
The growth of the Oregon Grape is influenced by environmental variables: shade, rain, air quality, etc. We’re using video footage and environment measures to learn about how these factors interact, and what this means for the plants and visiting pollinators!
Air Quality
You can read more on different ways that we measure the air in our Air Quality Story
Flower-insect timed (FIT) counts
| FIT Counts for April 20th-21st 2021 | |||||||
| Bumble bees | Honey bees | Other bees | Hover flies | Bee flies | Other | Total | |
|---|---|---|---|---|---|---|---|
| April 20 2021 | |||||||
| 09:00 | 1 | 0 | 0 | 0 | 0 | 0 | 1 |
| 11:00 | 4 | 0 | 0 | 0 | 0 | 0 | 4 |
| 13:00 | 5 | 0 | 0 | 0 | 1 | 0 | 6 |
| 15:40 | 4 | 0 | 0 | 1 | 1 | 0 | 6 |
| April 21 2021 | |||||||
| 09:00 | 1 | 0 | 0 | 0 | 0 | 0 | 1 |
| 11:00 | 2 | 0 | 0 | 0 | 0 | 0 | 2 |
| 13:00 | 3 | 0 | 2 | 0 | 0 | 3 | 8 |
| 15:40 | 5 | 0 | 2 | 0 | 0 | 0 | 7 |
FIT counts provide an estimate of the proportion of pollinators seen in time lapse pictures
Details
- 10 min counts of pollinators visiting at four time points during the day
- Observation area includes 48 inflorescences
Weather conditions
- full sun, light wind
- AM 12-13C ; PM 16-18C
Total number of pollinators over 40min of observation
- Apr 20th n=17
- APR 21st n=18
More pollinators in afternoon than morning
- Apr 20th AM N=5; PM N=12
- APR 21st AM N=3; pm n=15
Pollenator counts from video footage
| Counts from Video Footage April 22nd 2021 | |
| Time | Number of Pollinators |
|---|---|
| 10:05 - 12:00 | 4 |
| 12:00 - 16:00 | 12 |
| 16:00 - 20:20 | 18 |
| Total | 34 |
Video footage was collected from April 21st - May 4th. Our cameras were set to collect 4 min of footage every 5 min. Video counts provide an estimate of the proportion of pollinators seen in time lapse pictures.
Details
- April 22nd 10.05am – 8.20pm
- 10 hrs of data collection giving 8hrs of footage
- Observation area includes 7 inflorescences
- Pollinator ID – mostly bumblebees, with occasional mason bees, and bee flies
Weather conditions
- Full sun, light wind
- AM 13-15C ; PM 15-16C
Total number of pollinators over 8 hrs of observation
- n=24
More pollinators in afternoon than morning
- AM N=4; PM N=20
Pollinator visits during peak blooming
| FIT Counts and Video Footage counts give similar results | ||
| Flower-Insect Timed Counts | Video Footage Counts | |
|---|---|---|
| Dates | April 20th-21st | April 22nd |
| Number of hours observed | 14 | 10 |
| Number of inflorescences observed | 48 | 7 |
| Average number of pollinator visits per hour | 26 | 4.25 |
| Number of pollinators per hour per inflorence | 0.54 | 0.61 |
Having good estimates is important for when we want to make use of time-lapse images. Collection of these time-lapse images started in March, and is ongoing.
With these images, we’re collecting training data for a neural network that in the future we can use to automatically determine number of pollinators visiting the Oregon Grape.
Thanks to the Young Entomologists at Biodiversity Galiano, who are helping us identify pollinator species, we will be able to train the neural network to detect and count the visitation habits of different pollinator species to the Oregon Grape during bloooming